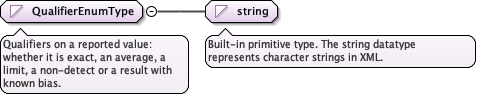
Qualifiers on a reported value: whether it is exact, an average, a limit, anon-detect or a result with known bias.
Diagram
Type
restriction of string
Facets
enumeration
exact
The value is exact. This is the default condition unless other qualifier values are given.
enumeration
average
The value is an average of measurements over a time or distance interval.
enumeration
less than
The value is below a stated threshold. Used where an analyte was notdetected or was below the threshold: if 3.6 is the limit, the result issomewhere below it.
enumeration
greater than
The true value exceeds the reporting or calibration range.
enumeration
non-detect
Specifically for instrumental "not detected" results where nosignal was distinguishable from noise.
enumeration
saturated
The instrument sensor was overloaded (saturated) by the signal,meaning the reported value is the maximum "clipped" output and the truevalue is likely much higher.
enumeration
limit of detection
The lowest value that can be identified with 99% confidence as being greaterthan zero.
enumeration
low bias
The result is likely an underestimate of the true value due toknown systematic error (e.g., sample loss).
enumeration
high bias
The result is likely an overestimate (e.g., due to contaminationor interference).
Source
<simpleType name="QualifierEnumType"><annotation><documentation>Qualifiers on a reported value: whether it is exact, an average, a limit, a non-detect or a result with known bias.</documentation></annotation><restriction base="string"><enumeration value="exact"><annotation><documentation>The value is exact. This is the default condition unless other qualifier values are given.</documentation></annotation></enumeration><enumeration value="average"><annotation><documentation>The value is an average of measurements over a time or distance interval.</documentation></annotation></enumeration><enumeration value="less than"><annotation><documentation>The value is below a stated threshold. Used where an analyte was not detected or was below the threshold: if 3.6 is the limit, the result is somewhere below it.</documentation></annotation></enumeration><enumeration value="greater than"><annotation><documentation>The true value exceeds the reporting or calibration range.</documentation></annotation></enumeration><enumeration value="non-detect"><annotation><documentation>Specifically for instrumental "not detected" results where no signal was distinguishable from noise.</documentation></annotation></enumeration><enumeration value="saturated"><annotation><documentation>The instrument sensor was overloaded (saturated) by the signal, meaning the reported value is the maximum "clipped" output and the true value is likely much higher.</documentation></annotation></enumeration><enumeration value="limit of detection"><annotation><documentation>The lowest value that can be identified with 99% confidence as being greater than zero.</documentation></annotation></enumeration><enumeration value="low bias"><annotation><documentation>The result is likely an underestimate of the true value due to known systematic error (e.g., sample loss).</documentation></annotation></enumeration><enumeration value="high bias"><annotation><documentation>The result is likely an overestimate (e.g., due to contamination or interference).</documentation></annotation></enumeration></restriction></simpleType>